Sunday, February 15, 2015

Activity 3: Philippine Coins and their Densities

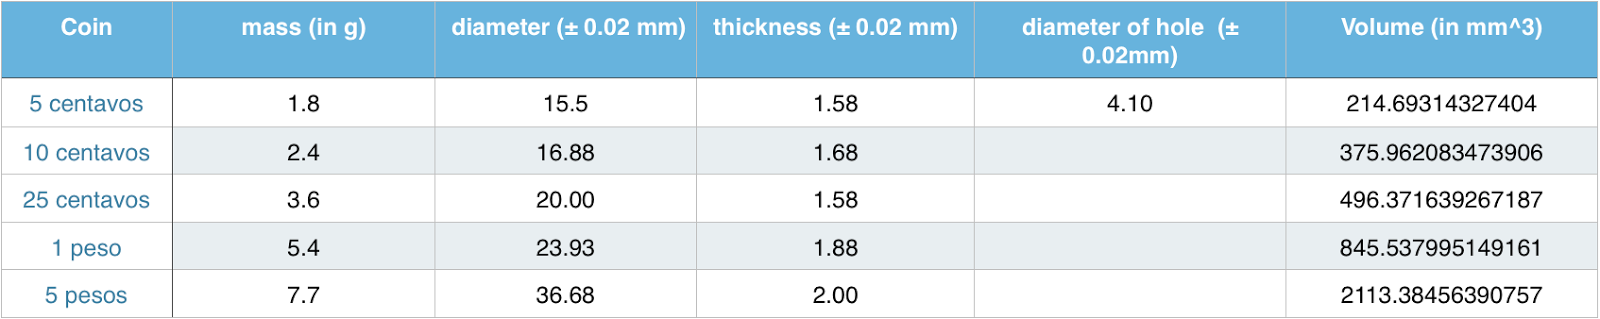
Activity 3 was still about measurement. Here, we were asked to measure the 5 centavo coin, 10 centavo coin, 25 peso coin, 1 peso coin and 5 peso coin, and find their densities. We measured the diameter and thickness of the coin using a vernier caliper, and each coin's mass using a weighing scale.

Measurement of the coins:


With these measurements, we are able calculate the volumes (v) of the coins. Since v = pi*r^2*t and r = d/2, v = (pi*d^2*t)/4. As for the 5 centavo coin which has hole,  its volume can be found by calculating the volume of the coin disregarding the hole, and subtract it by the volume of the hole of the coin.


The next step is to find the density. Density is equal to mass over volume.
Hence:


Acitvity 1 & 2: Length of a Rice Grain

The laboratory activity for this day (February 2, 2015) focused on the proper handling of the vernier caliper, the first part of Activity 1. The class used the vernier caliper to measure grains of rice. We were asked to measure at least 50 rice grains. We also recorded the results from the measurements done, compared our own group’s data with others and checked whether the results correspond to the grain’s approximate measure, (7.09mm ± 0.36mm). It was a helpful activity since it was my first time to use a caliper. It also taught me that systematic errors are bound to happen when dealing with measurements, but one can get an accurate and precise measurement.

-

Activity 2 was also measuring grains of rice, but this time, using a micrometer caliper. The micrometer caliper was a more sensitive device compared to the vernier caliper because a parallax would result to error. But when handled properly, it would give a more accurate measure because its degree of error is only ± 0.01mm, while the vernier caliper's degree of error is ± 0.02mm.

Combing the data of Activity 1 and 2, my group and I measured 50 rice grains for the vernier caliper, and 100 rice grains for the micrometer. The results from the accumulated data are as follows:

(Credits: Mike Go)

With the help of our classmate, Chris Sevilla, we were able to make a Gaussian Distribution of the data.

(Credits: Mike Go)


From the image above, we could see that the peak of the Gaussian Fit is 7.0956 mm to 7.1648 mm. The peak also represents the acceptable range of the length of the rice grains. Comparing this value to 7.09mm ± 0.36mm, we can conclude that our output is accurate.

Sources:

1. R.C. Batac, Different Levels of Approximation in Measruement, http://rcbteaching.blogspot.com/2015/02/physics-1011-different-levels-of.html, February 15, 2015
2. Sevilla, Christopher, What is the length of 1 Rice Grain, http://thephysics101p1files.blogspot.com/, February 15, 2015